The
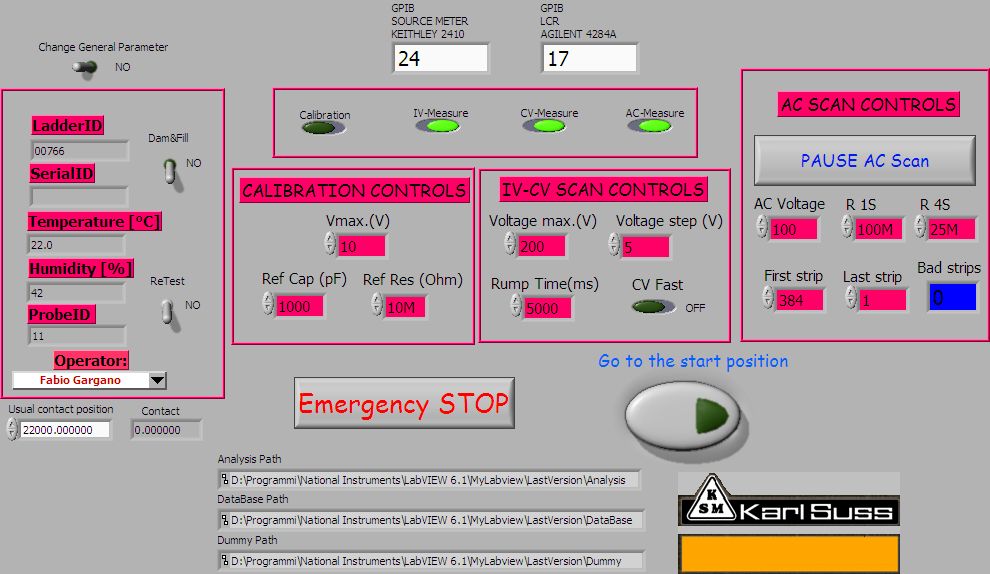
DAQ Software for the ladder electrical tests has been developed with LabView6.1.
The
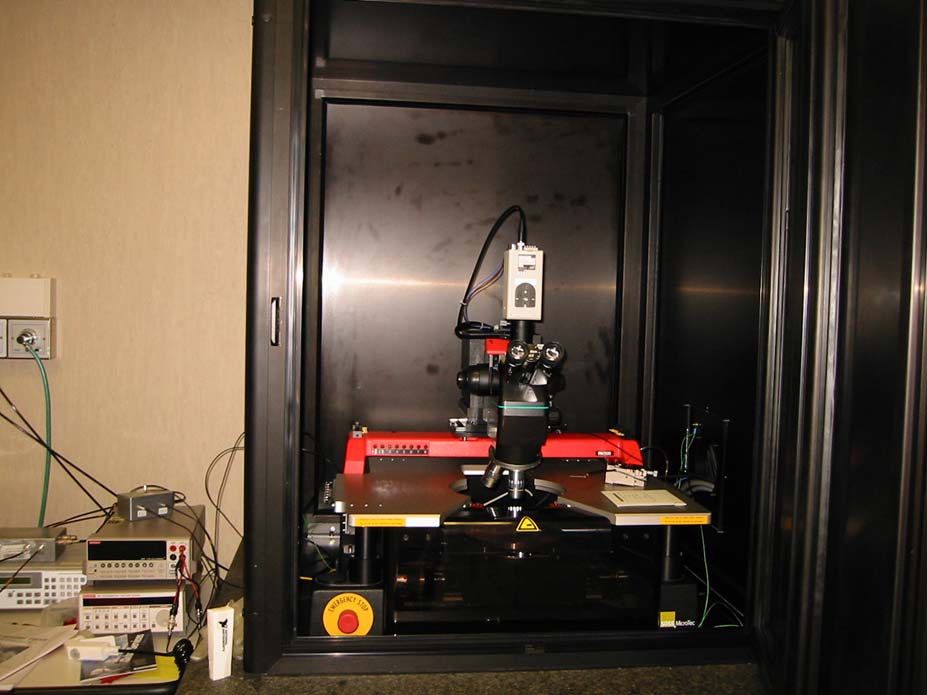
PA200 is controlled via the DAQ main software, that also sets all the parameters
for the three measures. It is also used to record all the environmental
parameters (temperature, humidity, operator) and the ladder ID.
For the IV and CV scan the probes are connected as in figure.
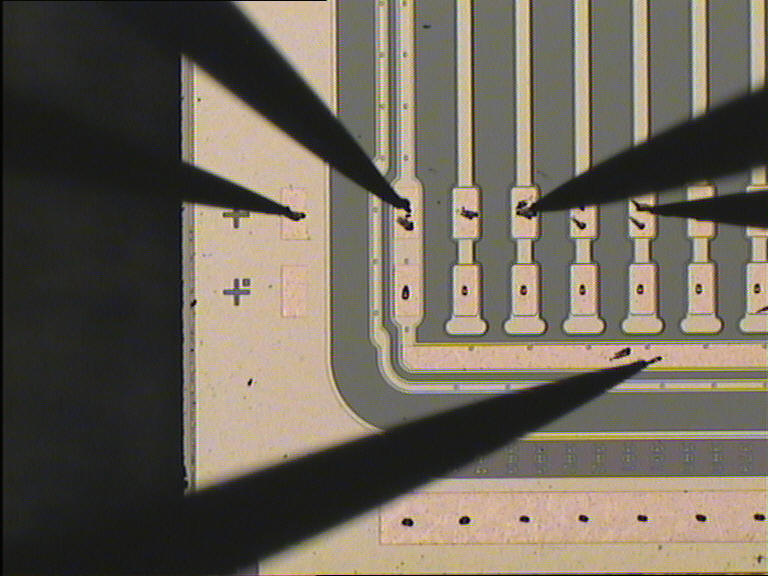
The active probe are the first to the left, used to contact the nsub
pad, and the one on the bottom used to
contact the bias ring. The bias voltage is set via the nsub
pad (up to +200V) and the bias ring
is at ground level.
| Probe Switch |
| Decoupling box |
| Keithley 2410 |
| I/V Switch |
| Agilent 4284A |
IV SCAN
During this test we measure the leakage current of the whole ladder at different value of the bias voltage. The DAQ layout is in shown below.
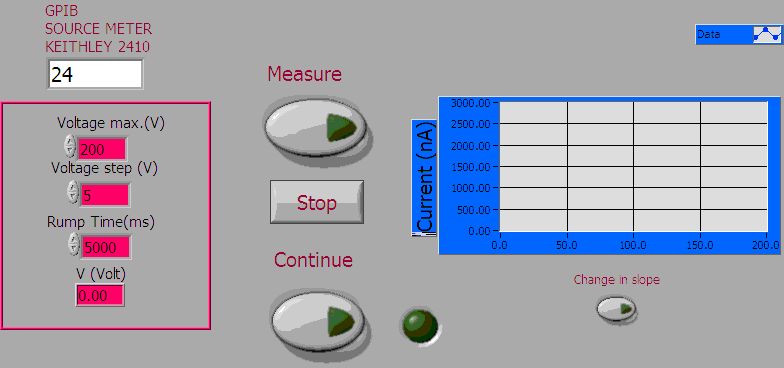
We can set the maximum bias voltage and the voltage step. The rump time is the time (in ms) from one step to the other. The values shown are the ones usually used. The Measure button start the measure, while the Stop button halt the measure. When the scan has been done, the light green turn on and, by parsing the Continue button it is possible to had any comment to the measure. The data are saved and stored in a data-base for the analysis. In the following figure are shown the results for the IV scan of a ladder before (blue dots) and after (purple dots) the dam and fill procedure. The current@150V is 800nA, that is four time the current@150V for a single wafer (200nA).
CV SCAN
With this test we intend to measure the bulk capacitance of the whole ladder and its depletion voltage. The DAQ layout is shown below.
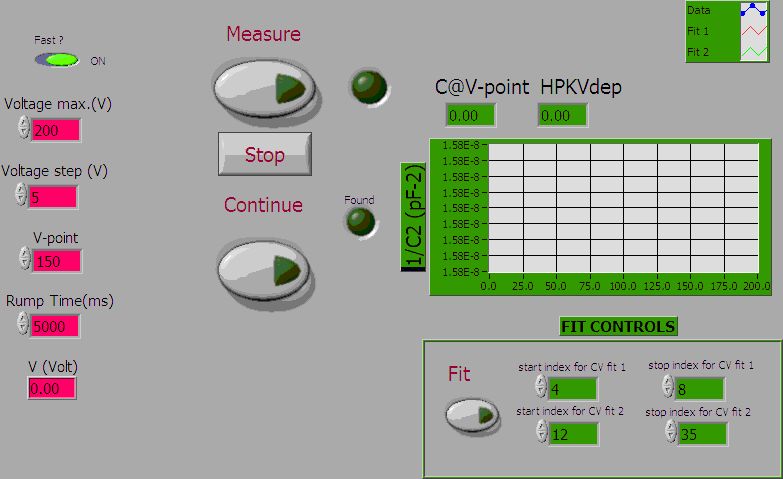
We can set the maximum bias voltage and the voltage step. The rump time is the time (in ms) from one step to the other. The values shown are the ones usually used. The Measure button start the measure, while the Stop button stop halt the measure. To evaluate the depletion voltage it is possible to use two different method:
1.Hamamatsu method The depletion voltage is the voltage at which:
![]()
When the depletion voltage is found the Found! led turn on
2. Double Fit method The depletion voltage is evaluated as the intersection point between the two lines that best fit the 1/C2 vs V curve.
The CVFast button is used to reduce the measurement time. If this option is ON, when the routine finds the depletion voltage with the first method, it reduces the rump time to 1/30 and doesn’t perform any measure. It measures only one point when the applied voltage equals the V-Point (usually 150V).
When the scan has been done, the light green turn on and, by pushing the Continue button it is possible to had any comment to the measure. The data are saved and stored in a data-base for the analysis. In the figure are shown the results for the CV scan of a ladder before (blue dots) and after (purple dots) the dam and fill procedure. The capacitance@150V is 7.4nF, that is four time the capacitance@150V for a single wafer (1.8nF).
AC SCAN
This scan is performed to find single strip defect on the decoupling capacitance. The measure is performed contacting the AC pads of 4 strips as in figure.
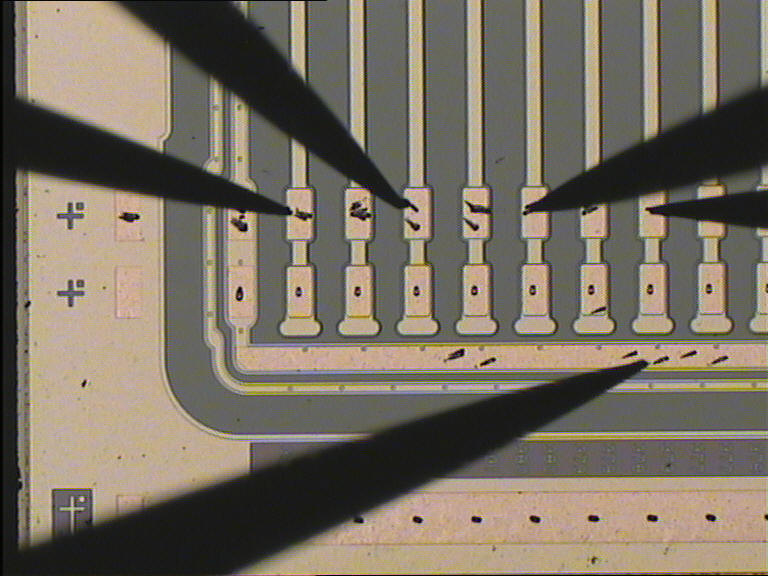
The 4 AC capacitance are charged with 100V for 1 sec and then they discharge. By measuring the charging and discharging time, the C value is measured. When all the strips are connected we measure 4 C in parallel, where every C is 4 times greater then the AC coupling capacitance of a single wafer. With this method we can find out different defects:
1. A failure in the bonding à A lower C value is measured
2. Coupling short à An higher current is measured at the end of the charge process
3. AC AL Open à A lower C value is measured
4. AC AL Short à An higher C value is measured
When we find a defect on a quartet, we scan all the four strip to find the wrong one.
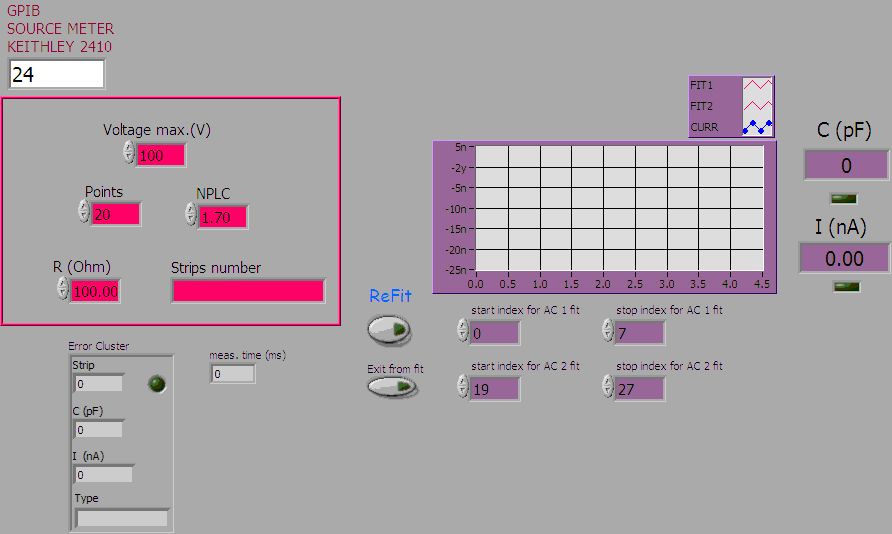
The DAQ layout is shown in the figure below.
We can set voltage and the number of points to measure during the charge and the discharge (Points). We can also set the measurement frequency (NPLC). The values shown are the ones usually used. The measure automatically starts and stops only if a bad current value or capacitance value are measured. This software controls also the probe station movement in order to perform automatically the ladder scan strip by strip.
Here are reported results for different strip defects.
AC AL SHORT
| BAD |
AC AL OPEN
| BAD |
COUPLING SHORT
| BAD |